
Data analysis · Python & SQL
Beyond the Crowds
Exploring what drives national park visitation.
I enjoy visiting parks to observe nature. While staying with my aunt in the Bronx, I noticed how much park activity varied between the places I walked or took the bus to. I wanted to understand what might be behind those differences.
Those were often NYC municipal parks. This analysis looks at National Park Service units nationwide—a different set of parks, connected by the same question.
Interactive charts could not load. The findings and data tables below remain available.
01 / Over time
A changing picture of visitation
Reported recreation visits fell 27.6% in 2020. By 2025, the total was 323.0 million—2.7% below 2024.
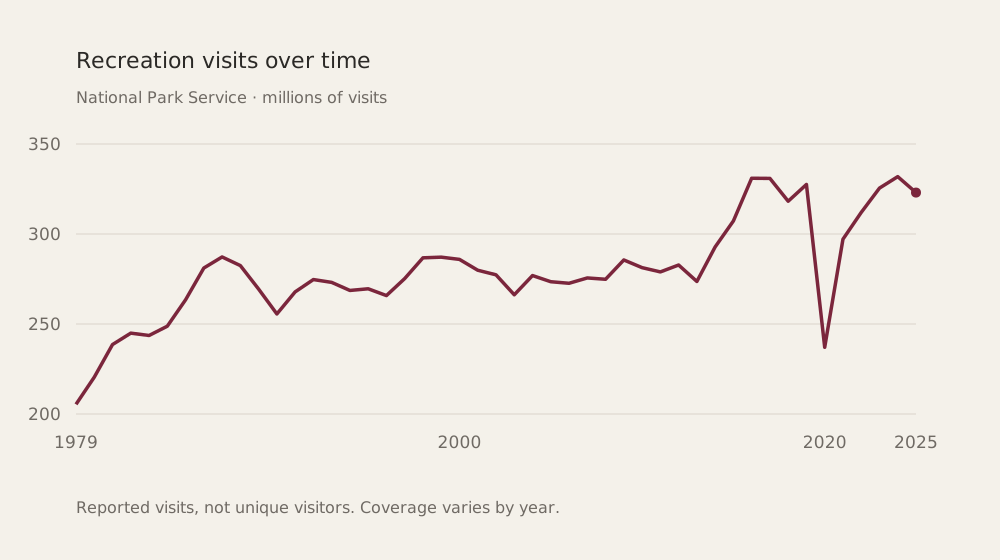
2025 · 323,014,305 recreation visits · 400 reporting codes
View annual data
| Year | Visits | Reporting codes |
|---|---|---|
| 1979 | 205,369,795 | 271 |
| 1980 | 220,463,211 | 275 |
| 1981 | 238,592,669 | 280 |
| 1982 | 244,924,579 | 290 |
| 1983 | 243,619,396 | 294 |
| 1984 | 248,785,509 | 296 |
| 1985 | 263,441,808 | 303 |
| 1986 | 281,094,850 | 304 |
| 1987 | 287,244,998 | 305 |
| 1988 | 282,451,441 | 309 |
| 1989 | 269,399,837 | 314 |
| 1990 | 255,581,467 | 316 |
| 1991 | 267,840,999 | 319 |
| 1992 | 274,694,549 | 324 |
| 1993 | 273,120,925 | 327 |
| 1994 | 268,636,169 | 327 |
| 1995 | 269,564,307 | 328 |
| 1996 | 265,796,163 | 329 |
| 1997 | 275,236,335 | 336 |
| 1998 | 286,762,265 | 342 |
| 1999 | 287,130,879 | 341 |
| 2000 | 285,891,275 | 344 |
| 2001 | 279,873,926 | 345 |
| 2002 | 277,320,211 | 349 |
| 2003 | 266,230,715 | 353 |
| 2004 | 276,908,376 | 356 |
| 2005 | 273,488,751 | 356 |
| 2006 | 272,623,980 | 359 |
| 2007 | 275,581,547 | 360 |
| 2008 | 274,852,949 | 360 |
| 2009 | 285,579,941 | 360 |
| 2010 | 281,303,769 | 363 |
| 2011 | 278,939,536 | 367 |
| 2012 | 282,765,682 | 367 |
| 2013 | 273,630,895 | 370 |
| 2014 | 292,800,082 | 370 |
| 2015 | 307,247,252 | 372 |
| 2016 | 330,971,689 | 376 |
| 2017 | 330,882,751 | 379 |
| 2018 | 318,211,833 | 379 |
| 2019 | 327,516,619 | 379 |
| 2020 | 237,064,332 | 383 |
| 2021 | 297,115,406 | 388 |
| 2022 | 311,985,998 | 389 |
| 2023 | 325,498,646 | 394 |
| 2024 | 331,863,358 | 398 |
| 2025 | 323,014,305 | 400 |
02 / Through the year
Summer leads, but weighting matters
July averages 14.1% of a unit’s annual visits, followed by June and August. Giving every unit equal weight reveals a different profile from counting every visit equally.
July · 14.1% · Equal weight per unit
View seasonal data
| Month | Equal unit weight | Visit-volume weight |
|---|---|---|
| 1 | 4.01% | 4.09% |
| 2 | 4.73% | 4.60% |
| 3 | 7.31% | 7.29% |
| 4 | 7.94% | 8.23% |
| 5 | 9.94% | 9.91% |
| 6 | 12.39% | 12.06% |
| 7 | 14.08% | 12.88% |
| 8 | 11.88% | 11.60% |
| 9 | 9.78% | 9.78% |
| 10 | 7.63% | 8.65% |
| 11 | 5.33% | 5.90% |
| 12 | 4.97% | 5.01% |
03 / Different kinds of places
Park designation carries information
The median unit averaged 1.16 million annual visits among National Recreation Areas, compared with 792,493 among National Parks and 27,335 among National Historic Sites.
● Median Line: middle 50% of unit averages
Select a designation to see its values.
Purpose, attractions, access, size, and counting practices differ across these places. This comparison does not show that a designation causes higher visitation.
View all designation data
| Designation | Units | Median visits | 25th percentile | 75th percentile |
|---|---|---|---|---|
| Parkway | 2 | 12,028,249 | 9,704,870 | 14,351,629 |
| Memorial Parkway | 1 | 6,968,970 | 6,968,970 | 6,968,970 |
| National Seashore | 10 | 2,226,613 | 535,602 | 2,657,405 |
| National River | 1 | 1,543,020 | 1,543,020 | 1,543,020 |
| National Scenic Riverways | 1 | 1,264,917 | 1,264,917 | 1,264,917 |
| National Recreation Area | 16 | 1,163,888 | 777,640 | 4,207,007 |
| Ecological & Historic Preserve | 1 | 1,022,139 | 1,022,139 | 1,022,139 |
| National Lakeshore | 3 | 932,652 | 593,306 | 1,277,996 |
| National Scenic Riverway | 1 | 853,127 | 853,127 | 853,127 |
| National Park | 51 | 792,493 | 417,194 | 2,593,331 |
| National and State Parks | 1 | 744,823 | 744,823 | 744,823 |
| National River & Recreation Area | 2 | 515,918 | 387,218 | 644,618 |
| Memorial | 2 | 398,749 | 252,286 | 545,213 |
| National Military Park | 9 | 385,539 | 192,414 | 738,048 |
| Park | 6 | 377,312 | 305,446 | 466,520 |
| National Monument and Historic Shrine | 1 | 369,056 | 369,056 | 369,056 |
| National Battlefield Park | 4 | 367,891 | 196,351 | 742,983 |
| Scenic & Recreational River | 1 | 361,524 | 361,524 | 361,524 |
| National Park & Preserve | 8 | 275,199 | 30,702 | 558,728 |
| National Historical Park and Preserve | 1 | 229,162 | 229,162 | 229,162 |
| National Battlefield | 10 | 178,264 | 132,807 | 279,744 |
| National Recreational River | 1 | 145,367 | 145,367 | 145,367 |
| National Historical Park | 59 | 112,576 | 36,933 | 412,013 |
| National Reserve | 1 | 90,969 | 90,969 | 90,969 |
| National Memorial | 15 | 85,969 | 33,136 | 165,822 |
| National Preserve | 9 | 81,051 | 14,013 | 724,569 |
| National Monument | 71 | 80,204 | 35,815 | 184,935 |
| National Monument & Preserve | 3 | 63,470 | 31,841 | 170,424 |
| National Scenic River | 2 | 44,741 | 29,265 | 60,218 |
| National Historic Site | 70 | 27,335 | 12,591 | 98,994 |
| International Historic Site | 1 | 13,807 | 13,807 | 13,807 |
| National Historical Park and Ecological Preserve | 1 | 13,014 | 13,014 | 13,014 |
| Wild River | 1 | 295 | 295 | 295 |
| Wild & Scenic River | 1 | 197 | 197 | 197 |
04 / What I learned
Useful associations, unanswered questions
A small regression benchmark tested designation and coordinates on 367 units, holding out whole units across 25 folds. Designation was more informative than coordinates alone.
- Coordinates only
- −0.005
- Designation only
- 0.273
- Both together
- 0.303
Mean R² on log-transformed mean annual visits; the training-mean baseline scored −0.016. The combined score varied across folds (SD 0.103). These are prediction checks—not original visit-count explanatory power, causal effects, or crowding forecasts.
What the counts leave out
Recreation visits are not unique visitors, and annual totals cannot tell us how crowded a trail feels on a particular day. Reporting methods and coverage change; current metadata also misses some reporting codes.
Nearby population, accessibility, acreage, and historical designation changes remain unresolved. Local entrance counts, trail use, and visitor experience would be needed before suggesting staffing or access changes.
Source: NPS Visitor Use Statistics, 2025, with current NPS API metadata. Analysis snapshot: October 2026, commit 5f5bb2f. Four negative monthly records are quarantined and 15 partial unit-years flagged; historic totals sum available valid observations.